Chaos Engineering with Gremlin Free and New Relic Infrastructure

New Relic Infrastructure is the infrastructure monitoring tool in New Relic’s observability suite. Gremlin is a simple, safe and secure service for performing Chaos Engineering experiments through a SaaS-based platform. Gremlin Free is a free version of Gremlin that can run on up to four hosts, and run two types of Chaos Engineering attacks.
Prerequisites
To complete this tutorial you will need:
- A host running Ubuntu 18.04 to run the Chaos Engineering experiments on. This host will run the Gremlin agent. You need to have permissions to run commands as root with sudo on this host.
- A Gremlin Free account (sign up here).
- A New Relic account (sign up for a free trial here).
Overview
This tutorial will show you how to use New Relic’s Infrastructure monitoring tool along with Gremlin Free for your Chaos Engineering experiments. Observability is an important part of Chaos Engineering, as it’s how we view the results of the experiments.
- Step 1 - Install the Gremlin agent
- Step 2 - Install the New Relic agent
- Step 3 - Run a CPU attack
- Step 4 - Run a Shutdown attack
Step 1 - Install the Gremlin agent
First, ssh into your host and add the gremlin repo:
1ssh username@your_server_ip23echo "deb https://deb.gremlin.com/ release non-free" | sudo tee /etc/apt/sources.list.d/gremlin.list
Import the GPG key:
1sudo apt-key adv --keyserver keyserver.ubuntu.com --recv-keys C81FC2F43A48B25808F9583BDFF170F324D41134 9CDB294B29A5B1E2E00C24C022E8EF3461A50EF6
Then install the Gremlin client and daemon:
1sudo apt-get update && sudo apt-get install -y gremlin gremlind
After you have created your Gremlin Free account (sign up here) you will need to find your Gremlin Daemon credentials. Login to the Gremlin App using your Company name and sign-on credentials. These were emailed to you when you signed up to start using Gremlin.
Navigate to Team Settings and click on your Team. Make a note of your Gremlin Secret and Gremlin Team ID.
Then initialise Gremlin and follow the prompts:
1gremlin init
You are now ready to create attacks using the Gremlin App.
Step 2 - Install the New Relic agent
Install the New Relic Infrastructure agent in your Ubuntu host. The first step is to create a configuration file and add your license key:
1echo "license_key: LICENSE_KEY" | sudo tee -a /etc/newrelic-infra.yml
Replace LICENSE_KEY with your license key. If you’re not sure what your key is, you can find it by clicking on the pulldown in the upper right of New Relic and selecting Account Settings. It will be displayed on the right side of the screen.
Next, add New Relic’s GPG key.
1curl https://download.newrelic.com/infrastructure_agent/gpg/newrelic-infra.gpg | sudo apt-key add -
Create the agent’s apt repo:
1printf "deb \[arch=amd64] http://download.newrelic.com/infrastructure_agent/linux/apt bionic main" | sudo tee -a /etc/apt/sources.list.d/newrelic-infra.list
Update your apt cache.
1sudo apt-get update
Run the install script.
1sudo apt-get install newrelic-infra -y
Step 3 - Run a CPU attack
Log in at newrelic.com and click the Infrastructure link.

You should see metrics for the Ubuntu host that you installed the client on. If they don’t appear immediately, you might need to wait a few minutes for the new client data to display. You can also try refreshing your browser.

Next, we’ll change the resolution of the graphs that are displayed. By default they show a 60 minute view, but we want to see the results of our experiments more quickly so we’ll change that to 5 minutes. Click Time Picker in the menu above the graphs and select 5m:

Log into your Gremlin Free account. Click the Attack link in the left menu and then New Attack.

That will take you to the targeting screen. Targeting by host should be selected by default. Select your Ubuntu host that you installed the Gremlin agent on for the target:

You’ll see the Blast Radius graphic will reflect that you’re attacking one host.
Scroll down and click Choose a Gremlin. Click on Resource and then select CPU.

Scroll down and change the number of seconds for the attack to 120. Select All Cores from the pulldown list. Then, click Unleash Gremlin. That will begin the CPU attack.

Switch to your New Relic browser window or tab and view the results. You should see a spike in the CPU usage.

Step 4 - Run a Shutdown Attack
In the Gremlin UI click on Attack in the left menu and New Attack, as we did before. Select your Ubuntu host as the target.
Scroll down and click Choose a Gremlin. Select State, and then Shutdown. Leave the Delay set to 1 minute and leave Reboot selected. Then click Unleash Gremlin.

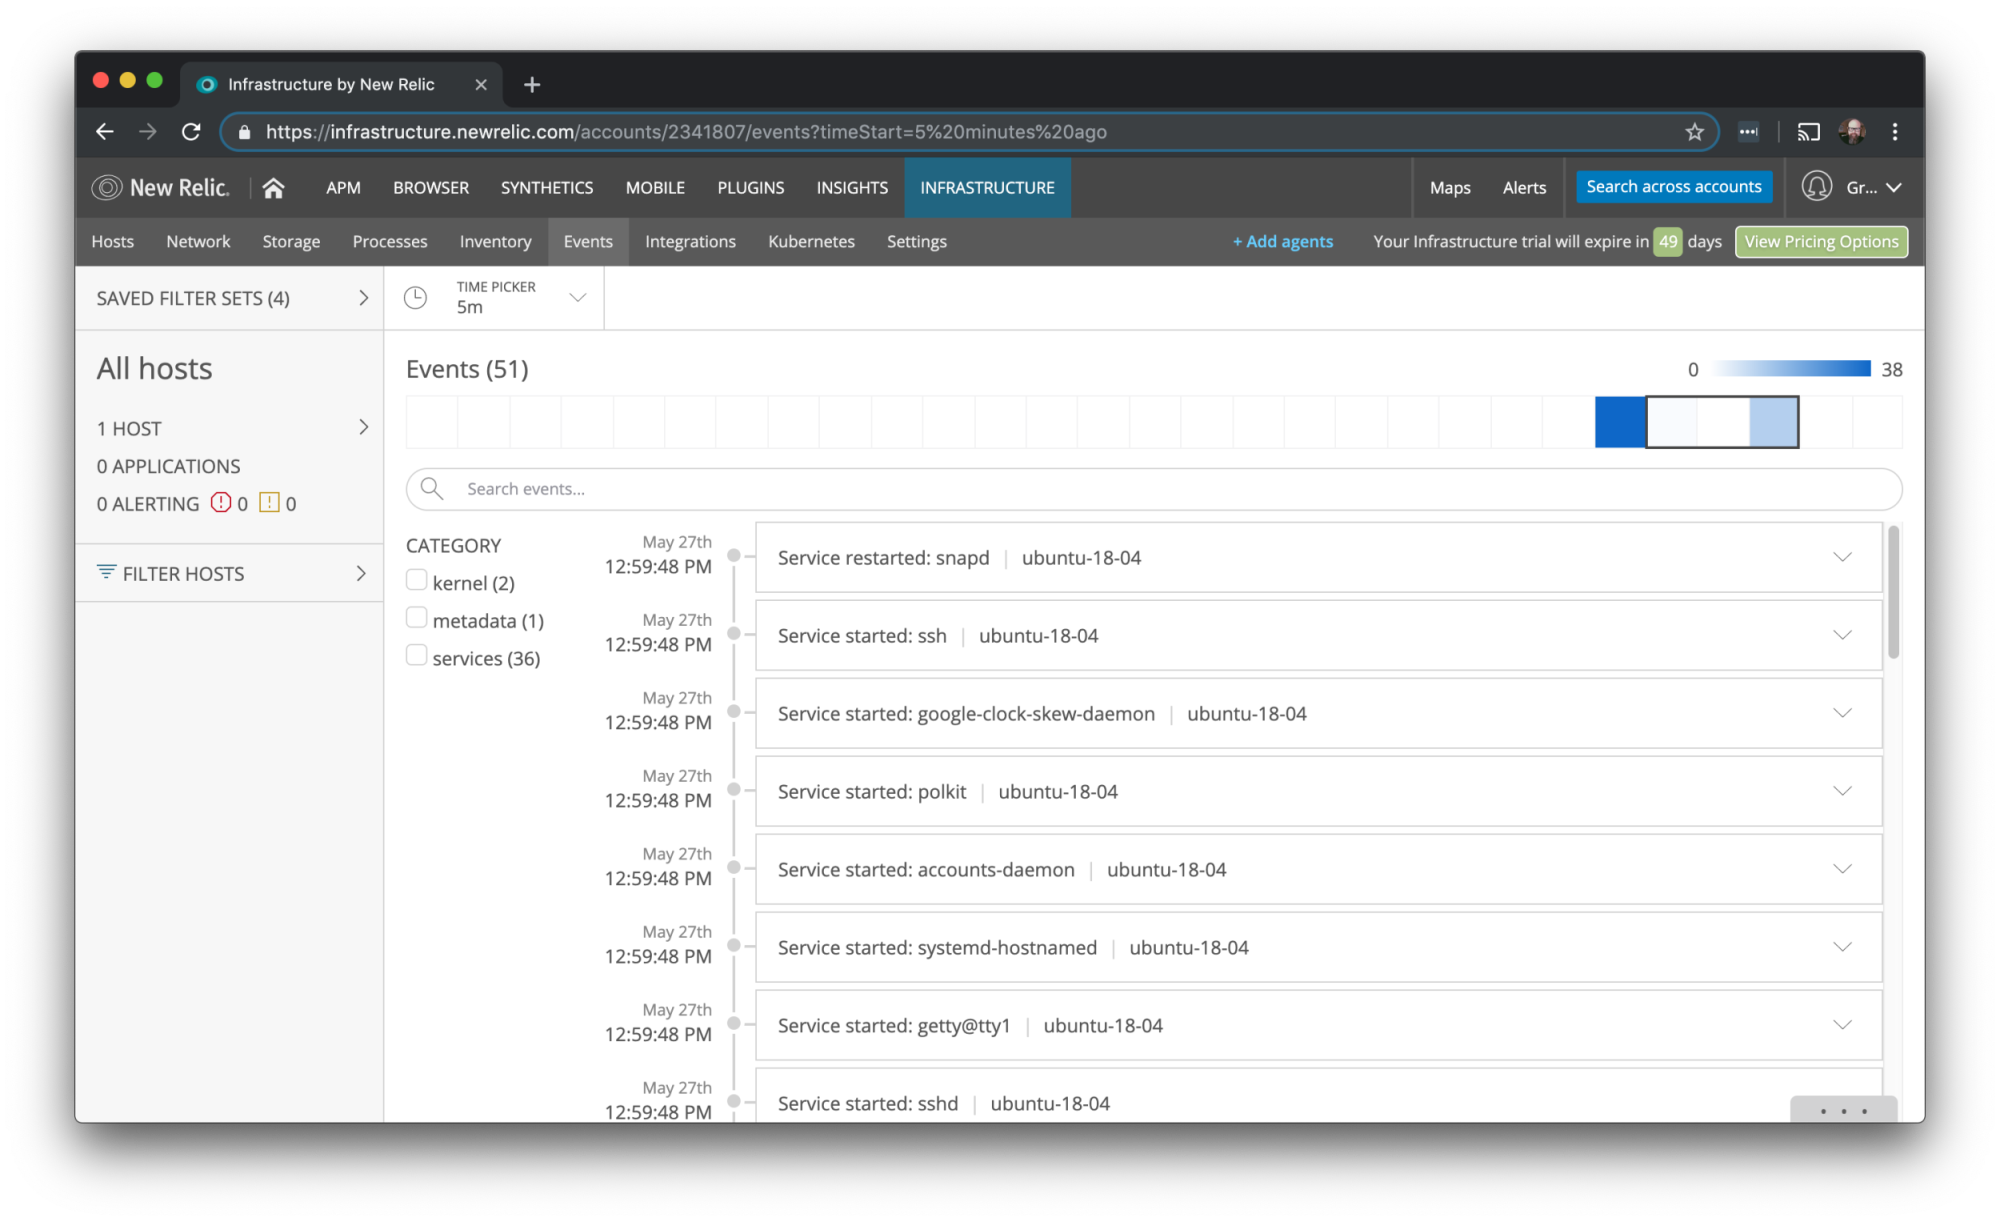
Go back to the New Relic UI and click on Events in the menu right above the graphs. You should see some new events start streaming in after the host reboots. If you don’t see anything new after a minute or two, you might try refreshing your browser.

Eventually you should see notifications from services that stopped and started when the host rebooted, as well as some other events.
Conclusion
We’ve seen how we can use Gremlin Free to perform CPU and Shutdown attacks, and how we can use New Relic’s Infrastructure tool to view metrics and events related to those attacks. There’s more you can do, like setting up alerts to let you know when a host reboots, or when the CPU threshold passes a certain amount. You could also create custom dashboards for your Chaos Engineering experiments with New Relic’s Insights product.
As we mentioned earlier, having observability tools is important for Chaos Engineering, as they give us the feedback we need about what happens in the experiments. New Relic’s Infrastructure tool is very flexible and provides the visibility we need to perform Chaos Engineering experiments.
Related


Avoid downtime. Use Gremlin to turn failure into resilience.
Gremlin empowers you to proactively root out failure before it causes downtime. See how you can harness chaos to build resilient systems by requesting a demo of Gremlin.
Get started